Whether you're new to cryptocurrency markets or looking to sharpen your trading edge, understanding how to analyze crypto prices is one of the most valuable skills you can develop. This guide walks you through the core methods of crypto price analysis — from reading charts and identifying patterns to understanding market indicators and fundamental drivers — so you can make more informed decisions in a volatile fast-moving market.
What Is Crypto Price Analysis?
Crypto price analysis is the process of evaluating digital asset prices to forecast future movement identify potential buying or selling opportunities. Unlike traditional equities, cryptocurrency markets operate 24/7 across global exchanges, which creates unique dynamics price behavior. Analysts typically rely on two primary frameworks: technical analysis (TA) and fundamental analysis (FA). While these approaches differ in methodology, many experienced traders combine them to build more complete picture of market conditions.
Understanding Technical Analysis
Technical analysis is built on the premise that historical price data trading volume can reveal patterns that tend to repeat over time. It does not concern itself with a project's intrinsic value but instead focuses entirely on price action and market psychology. At its core, technical analysis uses charts, indicators, and pattern recognition to predict short- and medium-term price movements. This makes it especially useful markets, where sentiment momentum can shift rapidly.

Reading Crypto Charts
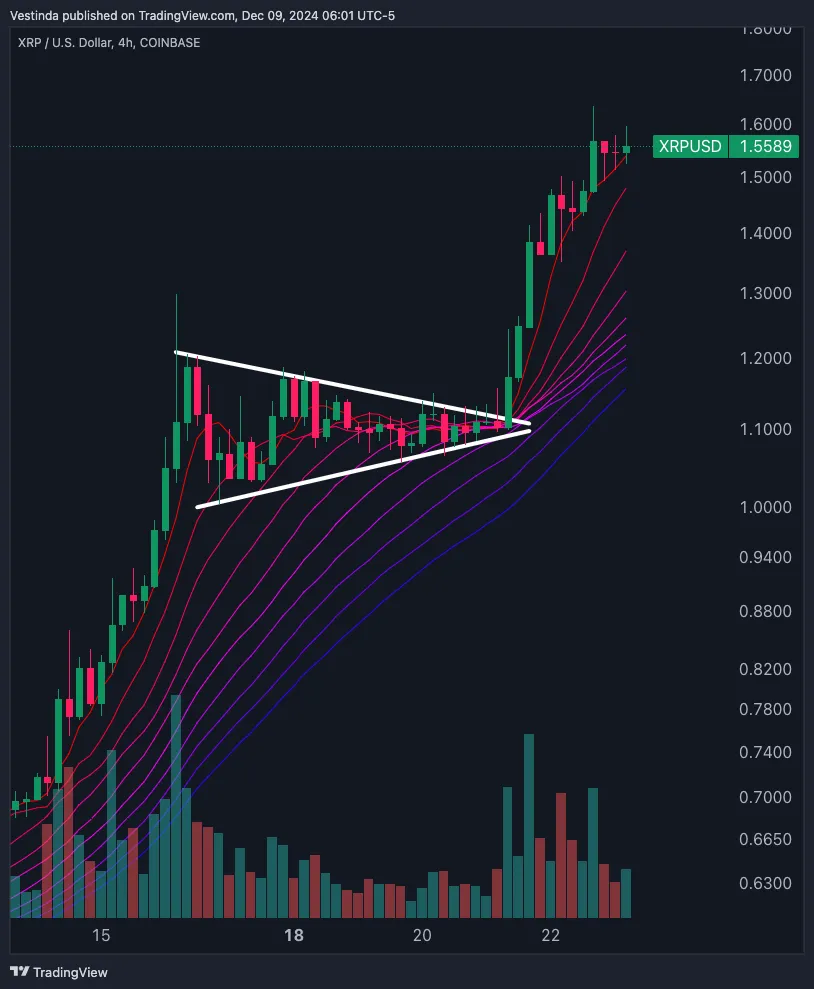
The most common chart type used in crypto analysis is the candlestick chart. Each candlestick represents a defined time period — such as 1 hour, 4 hours, or 1 day — and displays four data points: the open price, the close price, the high, and the low. The body of the candle shows the range between the open and close, while the wicks (also called shadows) represent price extremes during that period. A green white candle indicates that the price closed higher than it opened, signaling bullish momentum. A red or black candle indicates a lower close, signaling bearish pressure.
Line charts and bar charts are also available, though candlestick charts are preferred by most traders because they convey more information at a glance. Choosing the right time frame is equally important. Shorter time frames like 5minute or 15-minute charts are used day traders looking for quick entries and exits, while longer time frames like the daily weekly chart are more suitable for swing investors tracking macro trends.
Key Technical Indicators
Technical indicators are mathematical calculations applied to price and volume data to help identify trends,, volatility, and potential reversal points. Some of the most widely used indicators in crypto analysis include:
Relative Strength Index (RSI): RSI is a momentum oscillator that measures the speed and magnitude of recent price changes on a scale from 0 to 100. Readings above 70 suggest that an asset may be overbought and due for a pullback, while readings below 30 indicate oversold conditions that could precede a bounce In strong trending markets, RSI can remain extreme zones for extended periods, so it works best when alongside other indicators.
MACD (Moving Average Convergence Divergence): The MACD consists of two exponential moving averages and histogram measures the difference between them. When the MACD line crosses above the signal line, it can indicate a bullish shift momentum. A cross below the signal line suggests the Traders also watch for divergence between MACD and price as a potential early warning of trend reversals.
Bollinger Bands: These are volatility bands placed above and below a moving average. the bands contract, it signals low volatility and often precedes a significant price move. When touches the upper band, it may suggest overbought conditions; contact with the lower band may signal oversold territoryChart Patterns and Price Action
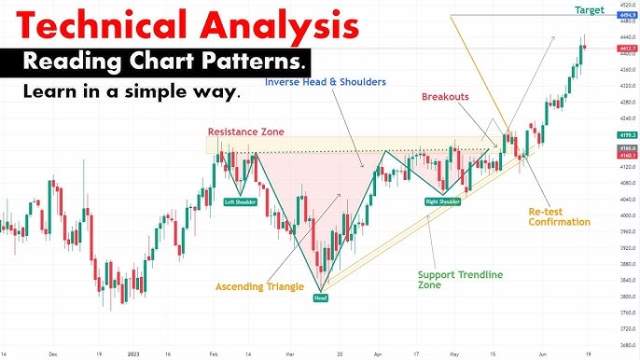
Beyond, chart patterns formed by price action itself are critical component of technical analysis. Continuation patterns, such as flags pennants, and triangles, suggest that the current trend is likely to persist after a brief consolidation phase. Reversal patterns, such as head and shoulders, double tops and double bottoms, signal potential turning points in the market.
Support and resistance levels are among the most fundamental concepts in price analysis. Support a price level where buying interest is strong enough to prevent further decline, while resistance is a level where selling pressure tends to cap upward movement. When a strong resistance level is broken with conviction, it often flips become new support — a concept known as role reversal that plays out repeatedly across markets.
Beginner's Approach to Crypto Technical>For those just starting out depth of technical analysis can feel overwhelming. The key is to begin with the basics build up your toolkit gradually. Start by learning how to identify trends price making highs and lows (uptrend), or lower highs and lower lows (downtrend)? Combine with one or two indicators, as the RSI and a moving average, rather than cluttering your chart with a dozen tools produce conflicting signals. src="https://markettactix.com/wp-content/uploads/2025/09/1-3.jpg" alt="Beginner's guide to crypto technical analysis showing patterns and key concepts for" />
Practice analyzing historical before applying any strategy real capital. Many platforms offer paper trading features that let you simulate trades without financial risk. Building confidence consistency in your process matters far more than finding perfect indicator secret
Fundamental Analysis in Crypto
While technical analysis focuses on price behavior, fundamental analysis evaluates the underlying value potential a cryptocurrency project. Key factors to assess include the project's use case problem it aims to solve, the strength track record of the development team, tokenomics (including total supply, circulating supply, inflation rate, and distribution), network activity metrics as daily active addresses and transaction volume, partnerships ecosystem growth and regulatory positioning
Onchain data has become an increasingly important branch of fundamental analysis in. Metrics like the Network Value Transactions ratio (NVT), exchangeflows and outflows, miner behavior, and whale wallet activity provide insight into market dynamics alone cannot reveal. Tools like Glassnode, Nansen, and Dune Analytics give analysts access to this kind of data in near real timeSentiment Analysis and Market Psychology
Crypto markets are heavily influenced by sentiment — the collective emotional state of market participants. Fear and greed cycles are particularly pronounced in digital markets due to the high participation retail investors and the influence of social media. The Crypto Fear Greed Index, which aggregates signals from volatility, market, social media, dominance, and trends, is widely referenced sentiment tool Extreme fear readings have historically corresponded with buying opportunities, while extreme greed readings have preceded corrections
Social media monitoring particularly on platforms like Xformerly Twitter) and Reddit, can provide early signals of shifting sentiment. Tracking the volume and tone of discussions around specific assets well as the behavior of influential figures the space, adds another qualitative layer to your analysis.
Risk Management in Crypto Analysis
No analytical framework eliminates risk entirely — that is especially true in cryptocurrency markets. Effective risk management is what separates consistent from those who blow up their accounts during periods of high volatility. Core risk management principles include defining your position size before entering a trade, always using stop-loss orders to cap losses, and never risking more than a small percentage of your total capital on a single position
Diversification across different asset classes and caps can reduce concentration risk. Keeping a portion of your portfolio in stablecoins during uncertain conditions gives you the flexibility to deploy capital when clear opportunities emerge. Maintaining a trading journal to document your analysis, entry exit rationale, and outcomes over time is one of the most underutilized practices continuous improvement.
Combining and Fundamental Analysis
most robust approach to crypto price analysis integrates both technical and fundamental methods. analysis helps you assets have long-term potential and worth monitoring, while technical analysis helps you time your entries and exits more precisely. For example, you might use fundamental research to build in a Layer blockchain protocol, then use technical analysis to wait for aation pattern bullish breakout signal committing capitalMulti-timeframe analysis is another powerful technique. Assessing a chart on weekly level establishes the trend context, while the4-hour or 1-hour be used to fine-tune an entry point. Trades taken the direction of the higher frame trend tend to have higher probability of success.ConclusionCrypto price analysis is a discipline that rewards patience,, and a commitment to continuous learning. Technical analysis gives you the tools to read structure and timing, while fundamental analysis grounds decisions in the realworld value of the assets you are Layering in awareness disciplined risk management completes the framework No single method provides certainty, but a well-rounded process dramatically improves your ability to navigate the complexities of cryptocurrency markets with confidence. Start with the basics, practice with purpose, and refine your approach as you gain experience.
Crypto Technical Analysis: Beginner’s Guide To Mastering Charts
Crypto Technical Analysis: Beginner’s Guide to Mastering Charts
A Complete Guide To Cryptocurrency Analysis – Cryptocurrency News
A Complete Guide to Cryptocurrency Analysis – Cryptocurrency News ...
Technical Analysis For Crypto CFD Trading: How To Read Price Charts And
Technical Analysis For Crypto CFD Trading: How To Read Price Charts And ...
How To Analyze Cryptocurrency Before Investing In It | PrimeXBT

How to Analyze Cryptocurrency Before Investing in It | PrimeXBT
Crypto Fundamental Analysis - A Beginners Guide - RR² Capital

Crypto fundamental analysis - A beginners guide - RR² Capital
Crypto Technical Analysis: Beginner’s Guide To Mastering Charts
Crypto Technical Analysis: Beginner’s Guide to Mastering Charts
A Beginner’s Guide To Crypto Technical Analysis | ZenLedger

A Beginner’s Guide to Crypto Technical Analysis | ZenLedger
The Ultimate Guide To Crypto Technical Analysis: Tools, Charts, And
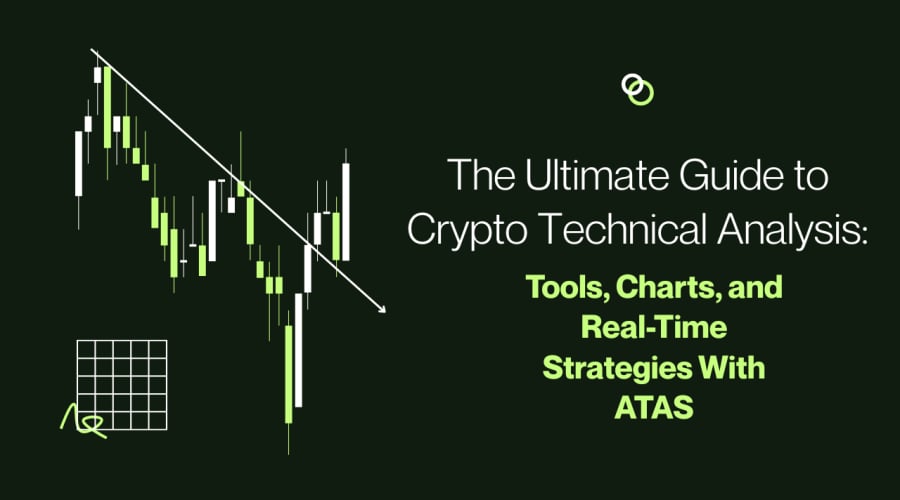
The Ultimate Guide to Crypto Technical Analysis: Tools, Charts, and ...
How To Analyse Cryptocurrency Before Buying

How to Analyse Cryptocurrency Before Buying
Volume Analysis In Crypto Trading: Amazing Guide 2025

Volume Analysis In Crypto Trading: Amazing Guide 2025
The Ultimate Guide To The Best Crypto Price Prediction Calculators In

The Ultimate Guide to the Best Crypto Price Prediction Calculators in ...
A Guide For Mastering Cryptocurrency Technical Analysis
A Guide For Mastering Cryptocurrency Technical Analysis
How To Read Crypto Charts For Day Trading At Douglas Hammond Blog
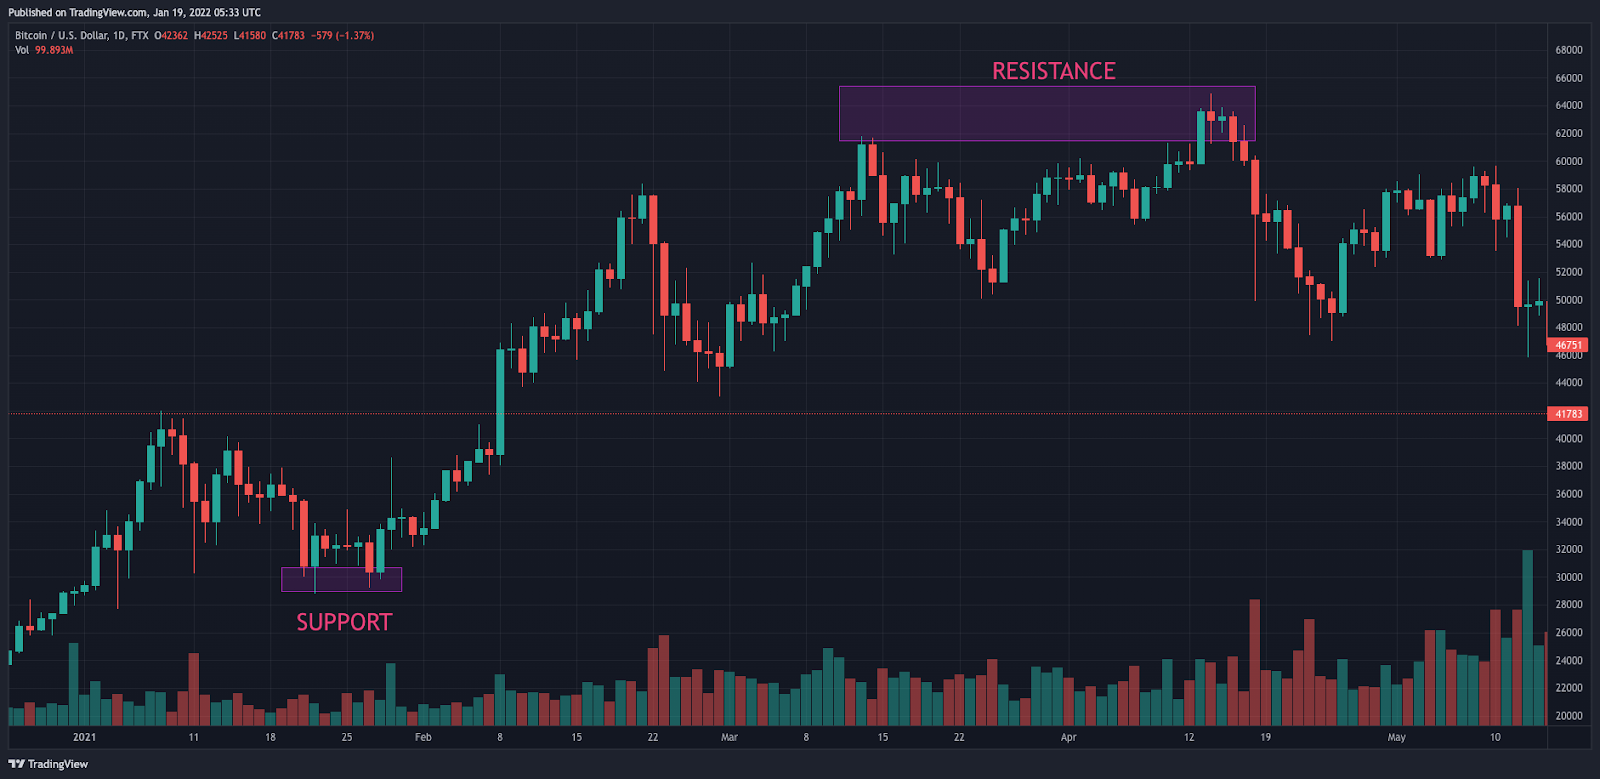
How To Read Crypto Charts For Day Trading at Douglas Hammond blog
How To Read Crypto Charts: A Beginner’s Guide To Technical Analysis

How to Read Crypto Charts: A Beginner’s Guide to Technical Analysis
Crypto Fundamental Analysis - A Beginners Guide - RR² Capital
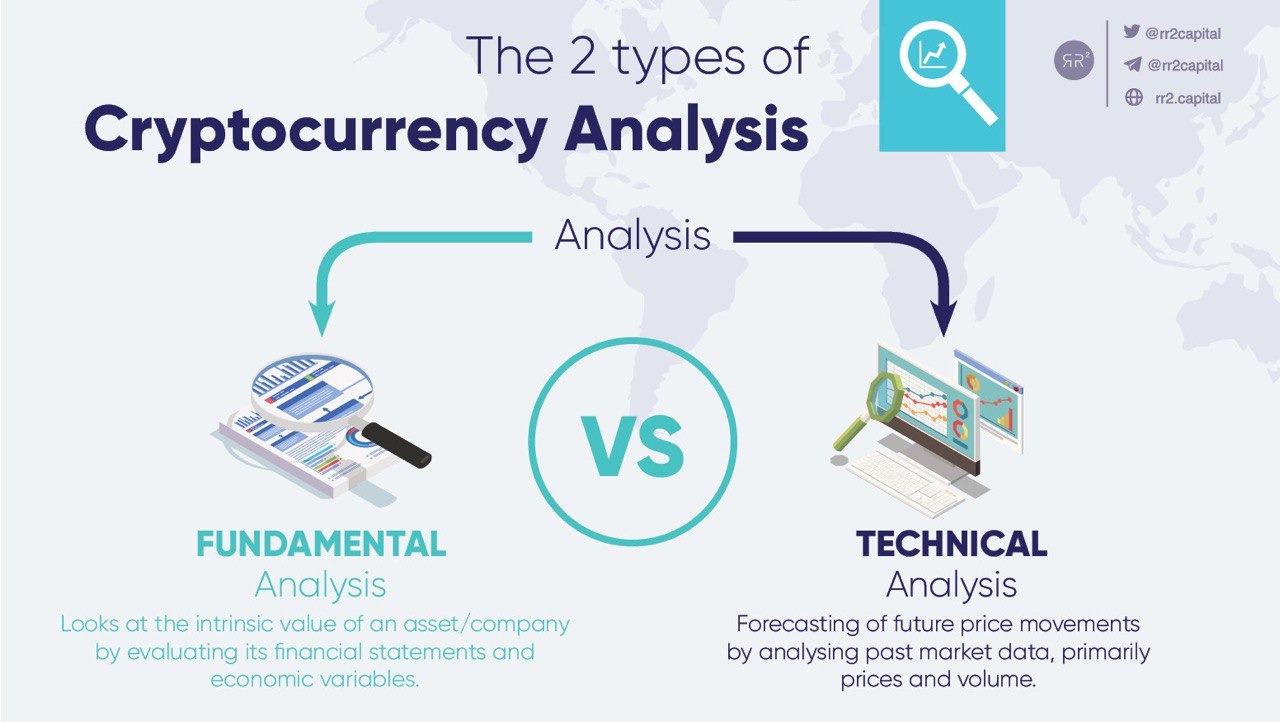
Crypto fundamental analysis - A beginners guide - RR² Capital
Crypto Fundamental Analysis Guide For Beginners - AiBlockChained

Crypto Fundamental Analysis Guide for Beginners - AiBlockChained
Understanding Crypto Price Analysis — Beginner’s Guides | By Bitcofun

Understanding Crypto Price Analysis — Beginner’s Guides | by Bitcofun ...
How To Conduct Crypto Price Action Analysis - UEEx Technology

How to Conduct Crypto Price Action Analysis - UEEx Technology
A Step-by-step Guide To Crypto Market Technical Analysis | Finder.com

A step-by-step guide to crypto market technical analysis | finder.com
Where Can I Buy Cryptocurrency Lets Break It Down
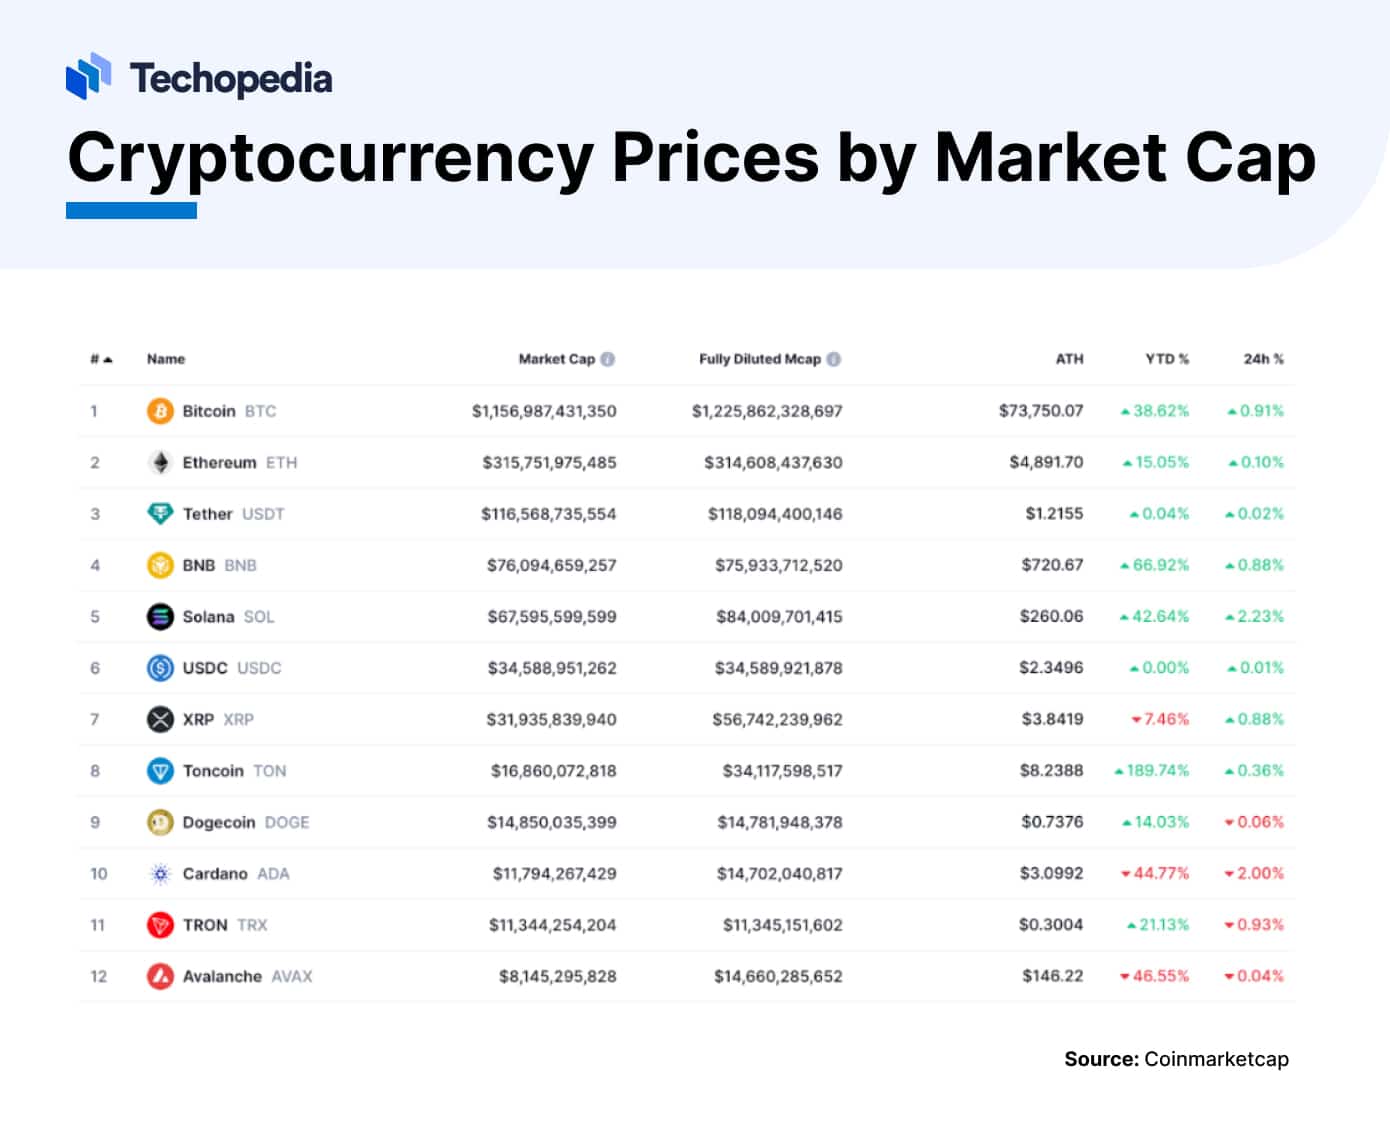
Where Can I Buy Cryptocurrency Lets Break It Down
Mastering Crypto Charts: A Guide To Spot & Futures Analysis | ZebPay

Mastering Crypto Charts: A Guide to Spot & Futures Analysis | ZebPay
How To Analyze Crypto Market Data Like A Pro

How to Analyze Crypto Market Data Like a Pro
Top 5 Crypto Price Technical Analysis 30th Nov To 5th Dec 2020

Top 5 Crypto Price Technical Analysis 30th Nov to 5th Dec 2020 ...
CYBER Hits 600% – Weekly Top 5 Crypto To Watch – CYBER, Shiba Inu, XRP
CYBER Hits 600% – Weekly Top 5 Crypto To Watch – CYBER, Shiba Inu, XRP ...
How To Read Crypto Charts For Day Trading: A Guide To Chart Analysis

How to Read Crypto Charts for Day Trading: A Guide to Chart Analysis
Technical Analysis In Crypto: Guide For Traders

Technical Analysis in Crypto: Guide for Traders
A Simplified Guide To Cryptocurrency Fundamental Analysis - UEEx Technology

A Simplified Guide to Cryptocurrency Fundamental Analysis - UEEx Technology
Understanding The Importance Of Cryptocurrency Charts
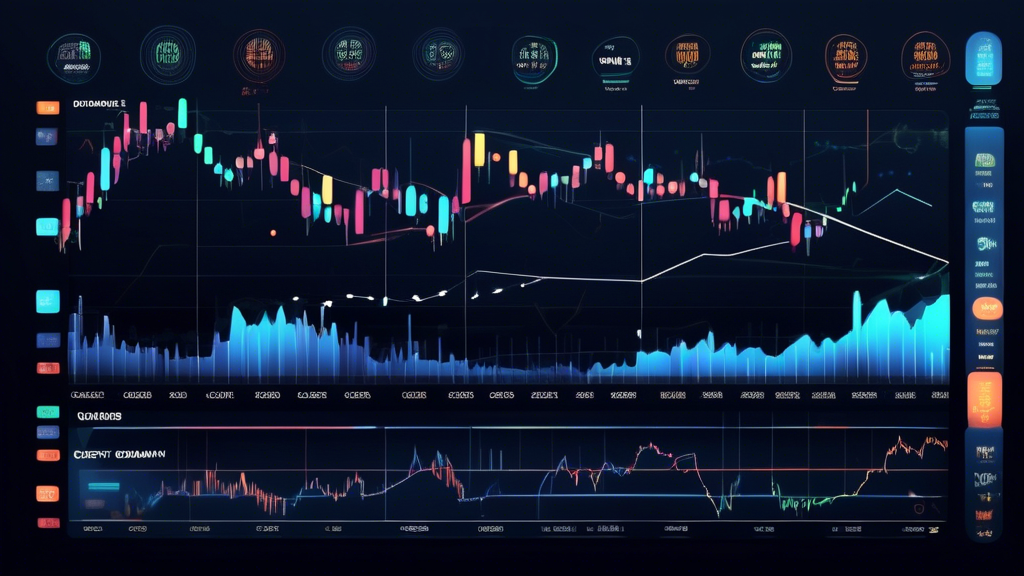
Understanding the Importance of Cryptocurrency Charts
The Ultimate Guide To Crypto Sentiment Analysis (2025) | TradingVibe
The Ultimate Guide to Crypto Sentiment Analysis (2025) | TradingVibe ...
How To Read Crypto Charts & Identify Trends Effectively | Blueberry
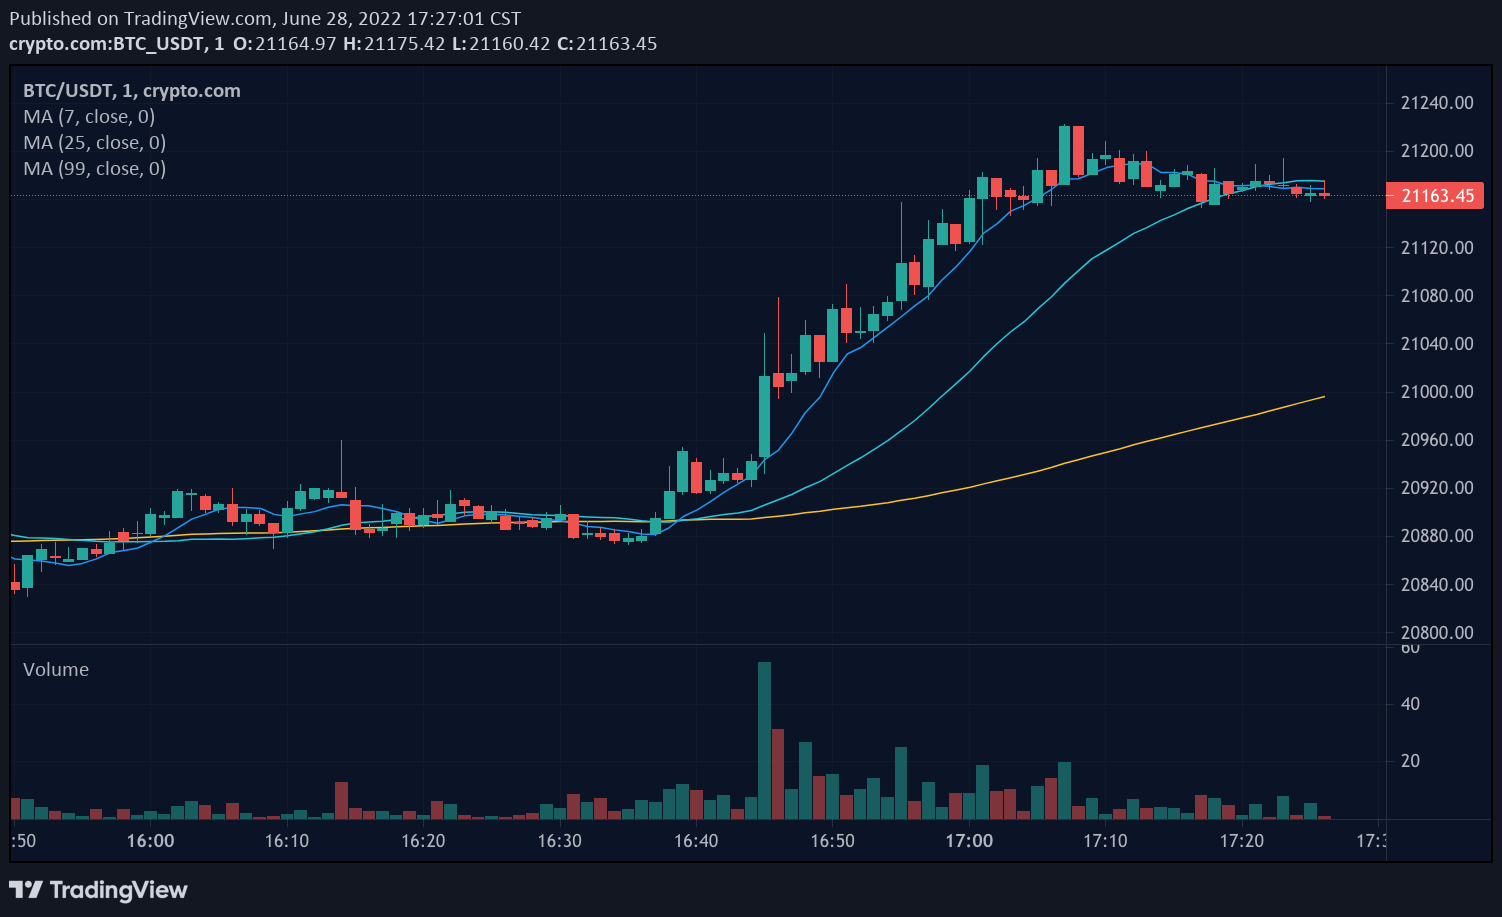
How to Read Crypto Charts & Identify Trends Effectively | Blueberry
Cryptocurrency Live Chart: A Complete Guide To Real-Time Analysis
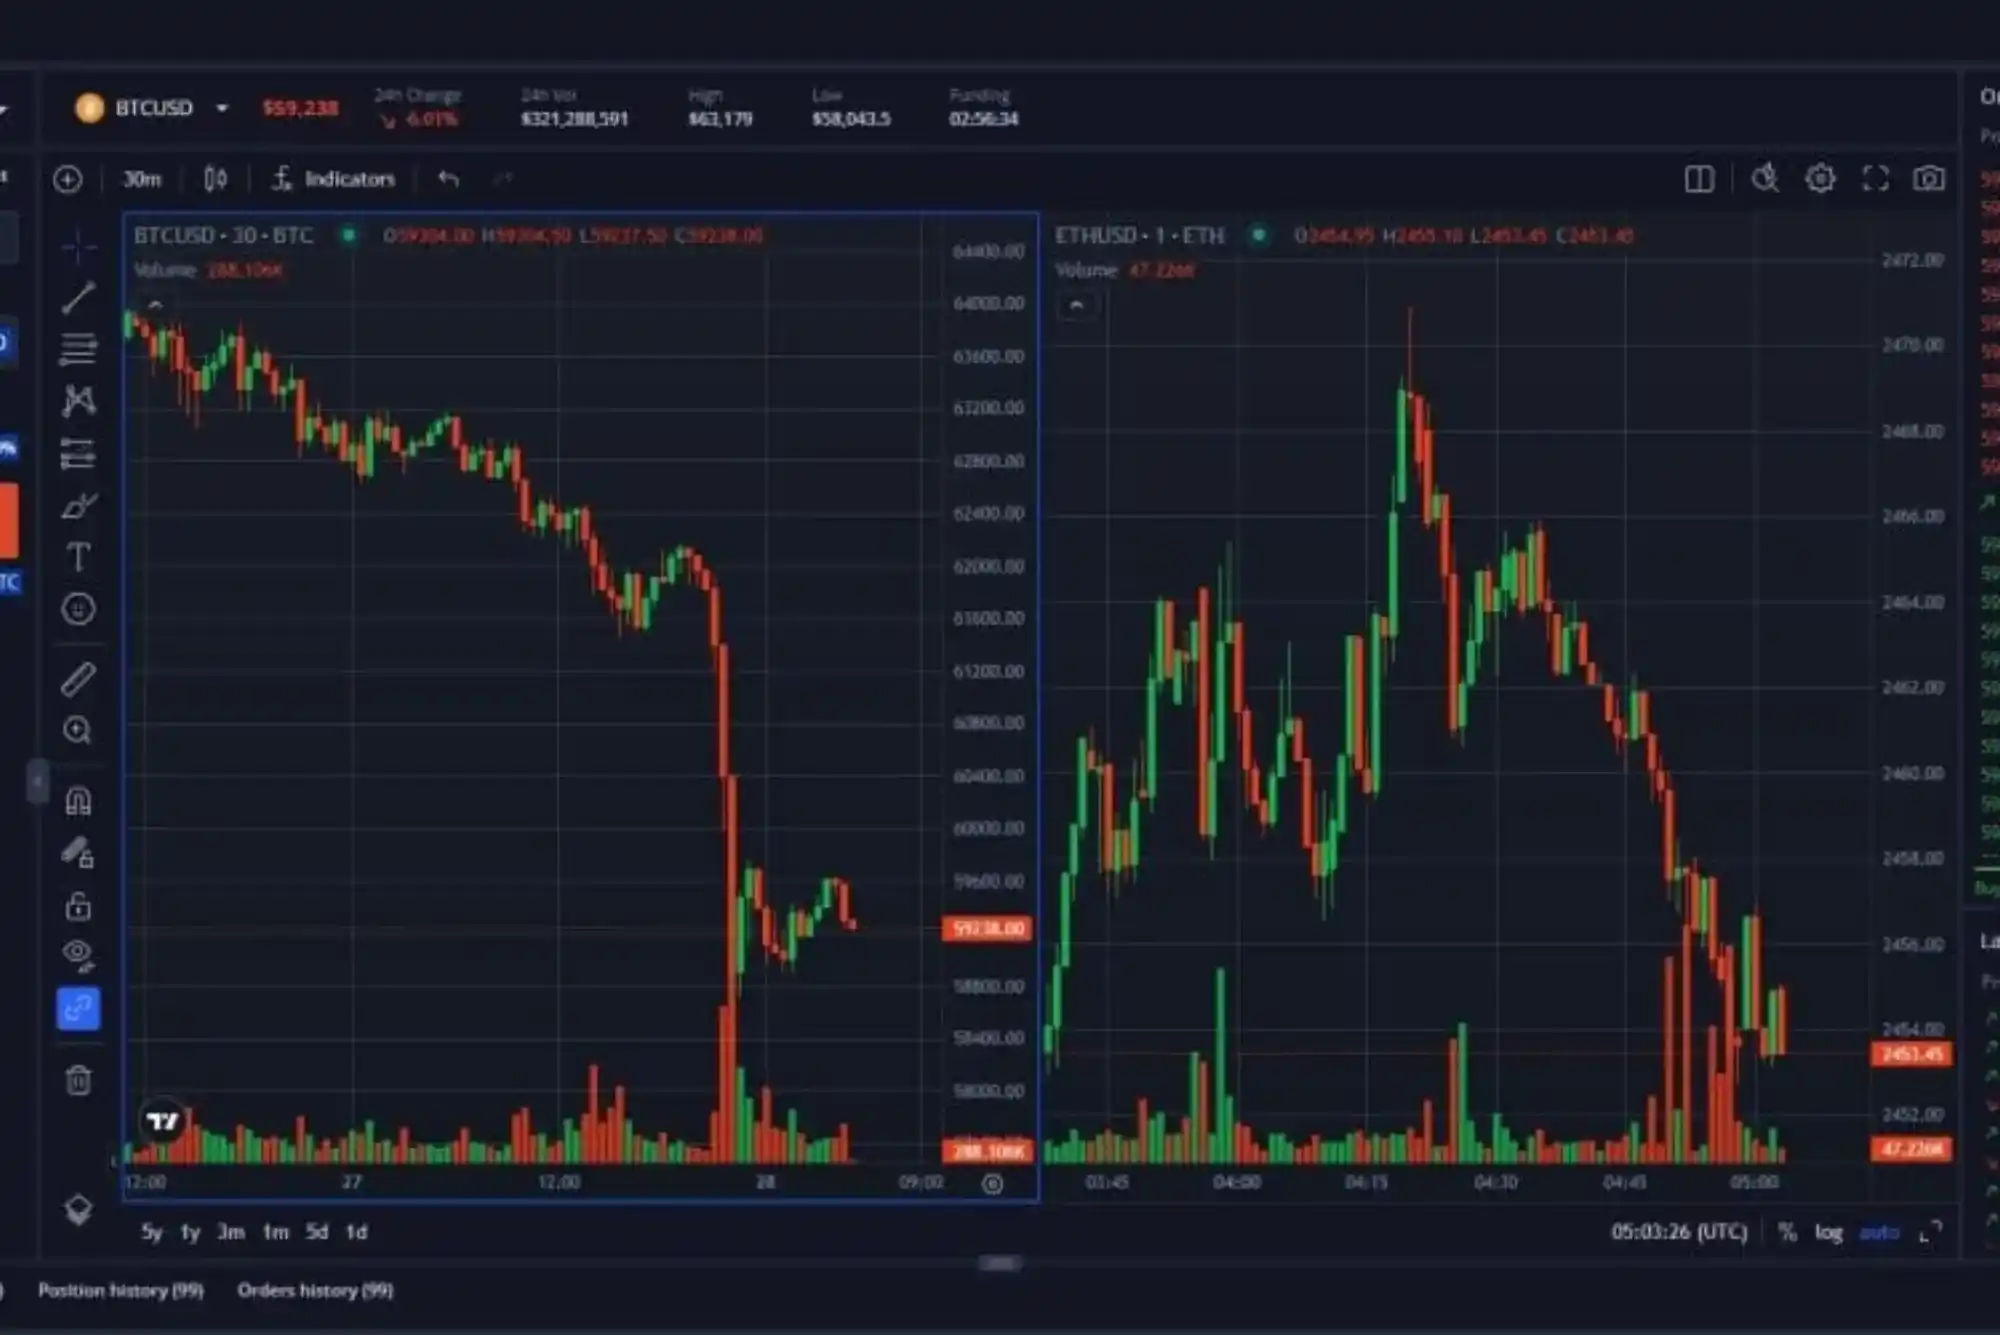
Cryptocurrency Live Chart: A Complete Guide to Real-Time Analysis
Types Of Cryptocurrency Analysis Guide: Technical & On-Chain
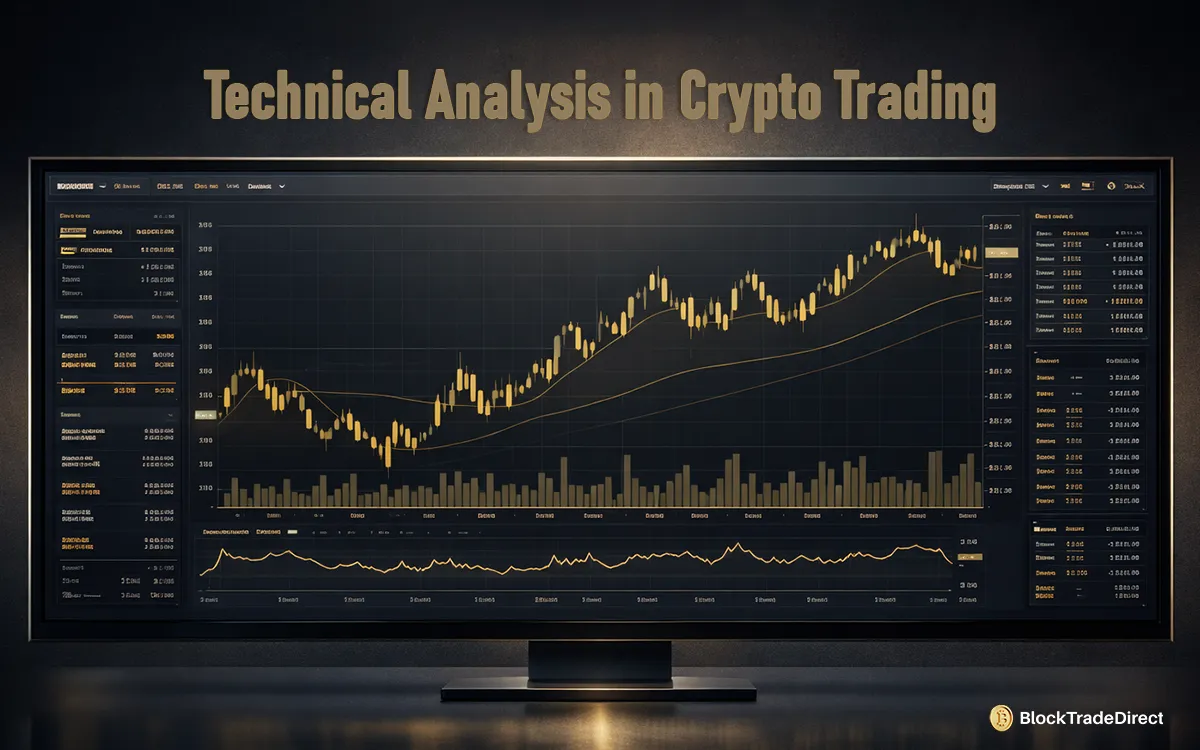
Types of Cryptocurrency Analysis Guide: Technical & On-Chain
Crypto Analysis: A Comprehensive Technical & Fundamental Guide For FX

Crypto Analysis: A Comprehensive Technical & Fundamental Guide for FX ...
🚀 Start Your Crypto Journey
Join millions of traders on trusted exchanges
✓ Low fees | ✓ Secure | ✓ Easy to use
Start Trading →